Examples and dataset statistics
Runnable model examples, the state-estimation recipe, and per-system statistics. See the top-level
../README.md for the quickstart and DATA_DICTIONARY.md for field definitions.
Continuous streams (LSTM / TGN)
The load/generate shard is a shuffled table of independent labeled snapshots — ideal for a per-scan classifier, but its rows are not consecutive in time. For temporal models and state estimation, each system also ships a continuous attacked stream: one running timeline of 72,000 distinct real-profile operating states (no reuse), ~50% under attack as timed episodes (re-solved on the real NYISO load trajectory), with per-timestep, per-bus labels. Every record carries three aligned measurement layers — for both node and branch-flow measurements:
s = fg.load_stream("ieee118")          # download the published stream (or fg.generate_stream(...) to build one)

# node measurements [T, N, 4] = [|V|, Pinj, Qinj, angle]
s["node_x"]   # OBSERVED feed: attacked+noisy where attacked, benign+noisy elsewhere (the model input)
s["benign"]   # the same meters with the ATTACK REMOVED (noise kept) — what they would read un-attacked
s["clean"]    # NOISELESS, attack-free TRUE state — the SE / reconstruction target
# branch-flow measurements [T, E, 2] = [P_from, Q_from], same three layers
s["edge_x"], s["edge_benign"], s["edge_clean"]

s["y"]          # [T, N] per-bus attack label   s["family"]  # [T] active family (0 = benign)
s["edge_index"] # [2, E] PyG connectivity        s["edge_attr"]  # [E, 8] line features (r,x,b,g,gs,bs,tap,shift)
s["node_m"], s["edge_m"]   # static meter masks — metering is SPARSE, so unmetered channels are zero-filled

Xw, yw = fg.windows(s, W=24, stride=12)  # slice [n, 24, N, 4] LSTM windows + labels
On the measured channels (see node_m/edge_m), observed − benign isolates the attack and benign − clean is meter noise. Those hold exactly for the in-place corruption families (Ad/As/Ar), which share the benign meter draw; for the stealthy re-solve families (Aq/At/Al) the whole operating point moves, so benign is a separate noise draw and the differences carry the state change plus noise — clean (the noiseless true state) is always the exact SE target.
Recipe: a temporal state estimator (attacked window → clean V/θ)
Feed an LSTM/TGN windows of the attacked measurements and train it to recover the clean state. The clean field is the noiseless, attack-free truth at every timestep (even on attacked ones), so the loss is estimated-state-vs-clean-target:
import fdia_graph as fg
import numpy as np

s = fg.load_stream("ieee118")               # one continuous timeline (attacks as timed episodes)

W, stride = 24, 12
Xw, yw = fg.windows(s, W, stride)           # Xw [n,W,N,4] attacked measurements, yw [n,N] attack label
starts = range(0, len(s["node_x"]) - W + 1, stride)
clean_w = np.stack([s["clean"][t:t+W] for t in starts])   # [n,W,N,4] clean state, windowed the same way

# column order is [|V|, Pinj, Qinj, angle]; the SE target is clean |V| and angle:
target = clean_w[..., [0, 3]]               # [n,W,N,2] clean V and theta

# training loop (sketch):
#   pred = model(Xw)                        # your LSTM/TGN: [n,W,N,2] estimated V, theta
#   loss = mse(pred, target)                # estimated state vs clean V/theta
Xw is the attacked, noisy input; target is the clean V/θ it should reconstruct. For a full SE measurement set, add the branch-flow measurements s["edge_x"] (windowed the same way) alongside the node measurements — node + edge from the same scan is exactly what a WLS/robust estimator consumes. Swap "ieee118" for any of the 8 systems, and attacked_frac/families via fg.generate_stream(...) to build a custom stream. The static branch admittance (ds.edge_attr, [E,8], includes edge_gs, edge_bs = 1/(r+jx)) comes from the matching shard fg.load("ieee118") if the model also needs line physics.
Temporal features (temporal_delta, swing) compare each frame to the previous emitted frame, so a stealthy ramp stays a small per-step change while a spike reads as an abrupt jump. Build a custom stream with fg.generate_stream(system, attacked_frac=0.5, families=[...], seed=...).
Three runnable baselines
All three report DR / FA / F1, never raw accuracy: ~98% of bus-scans are clean, so an all-negative model scores 0.98 accuracy while detecting nothing. Decision thresholds are selected on the val split (best F1) and test is evaluated once at that threshold. The headline example follows the protocol our papers use (train on benign + Aq + Ad, hold out As/Ar zero-shot, exclude the slow ramp, score macro-F1 over attackable buses); the other two train on every family so the hard ones stay visible. Each baseline trains in a few CPU minutes.
# shared helpers, used by all three examples
import torch

def pick_tau(logits, y):
    """Decision threshold with the best F1 on the VALIDATION split (never tune on test)."""
    best, tau = 0.0, 0.0
    for q in torch.linspace(0.80, 0.999, 60):
        c = torch.quantile(logits, q)
        p = logits > c
        f1 = 2 * (p & y).sum() / (p.sum() + y.sum()).clamp(min=1)
        if f1 > best: best, tau = float(f1), float(c)
    return tau

def report(p, t):
    dr = (p & t).sum() / t.sum(); fa = (p & ~t).sum() / (~t).sum()
    prec = (p & t).sum() / p.sum().clamp(min=1)
    print(f"DR {dr:.3f}  FA {fa:.4f}  F1 {2*prec*dr/(prec+dr):.3f}")

def macro_f1(p, t):
    """Per-bus F1 averaged over the attackable buses — the localization metric our papers report."""
    f1s = []
    for b in range(t.shape[1]):
        if not t[:, b].any(): continue
        tp = (p[:, b] & t[:, b]).sum(); fp = (p[:, b] & ~t[:, b]).sum(); fn = (~p[:, b] & t[:, b]).sum()
        pr = tp / max(tp + fp, 1); dr = tp / max(tp + fn, 1)
        f1s.append(2 * pr * dr / max(pr + dr, 1e-12))
    return sum(f1s) / len(f1s)
1. Per-bus MLP on the papers' 14-dim feature vector — the headline localizer. Each bus is described by the standardized measurements (4), the meter-availability mask (4, so the model can tell an unobserved channel from a genuine zero on this sparsely metered grid), a local Kirchhoff power residual (2, injection minus incident metered flows — a partial balance, since sparse metering leaves it incomplete at buses with an unmetered incident branch; the meter mask lets the model discount those), the scan-to-scan temporal_delta (2), and the windowed swing (2). Trained under the published protocol — benign + Aq + Ad, with As/Ar held out zero-shot — a 28k-parameter MLP localizes at 0.915 macro-F1 in about five CPU minutes; our tuned paper models reach 0.93–0.95 on the same protocol. Needs pip install "fdia-graph[torch]".
import numpy as np
import torch.nn as nn, torch.nn.functional as F
import fdia_graph as fg

torch.manual_seed(0)
FIELDS = ["node_x", "node_m", "edge_x", "temporal_delta", "swing", "y", "family"]
splits = {"train": fg.load("ieee118", split="train", families=[0, 1, 2]).to_numpy(FIELDS),
          "val":   fg.load("ieee118", split="val",   families=[0, 1, 2]).to_numpy(FIELDS),
          "test":  fg.load("ieee118", split="test",  families=[0, 1, 2, 3, 4]).to_numpy(FIELDS)}
ei = fg.load("ieee118", split="train").edge_index_np
N = splits["train"]["node_x"].shape[1]

def kcl(d):
    """Partial nodal power balance: injection minus incident metered branch flows (a true balance only
    where all incident branches are metered; the meter-mask channels flag the rest)."""
    r = np.array(d["node_x"][:, :, 1:3], np.float32)   # start from [P_inj, Q_inj]
    np.subtract.at(r, (slice(None), ei[0]), d["edge_x"])   # flows leaving the from-bus
    np.add.at(r, (slice(None), ei[1]), d["edge_x"])        # arriving at the to-bus
    return r

def feats(d, stats=None):
    """The papers' 14-dim per-bus vector: measurements(4) + meter mask(4) + KCL(2) + delta(2) + swing(2)."""
    raw = np.concatenate([d["node_x"], kcl(d), d["temporal_delta"]], -1)
    if stats is None: stats = (raw.mean((0, 1)), raw.std((0, 1)) + 1e-9)   # train statistics only
    z = (raw - stats[0]) / stats[1]
    return np.concatenate([z, d["node_m"], d["swing"]], -1).astype(np.float32), stats

Ftr, st = feats(splits["train"])
X = {"train": torch.tensor(Ftr).reshape(-1, 14)}
for s in ("val", "test"): X[s] = torch.tensor(feats(splits[s], st)[0]).reshape(-1, 14)
Y = {s: torch.tensor(d["y"], dtype=torch.float32).reshape(-1) for s, d in splits.items()}

m = nn.Sequential(nn.Linear(14, 160), nn.ReLU(), nn.Dropout(0.1),
                  nn.Linear(160, 160), nn.ReLU(), nn.Dropout(0.1), nn.Linear(160, 1))
opt = torch.optim.AdamW(m.parameters(), 1e-3)
pw = (1 - Y["train"].mean()) / Y["train"].mean()          # class weight from the TRAIN base rate
for step in range(12000):
    j = torch.randint(0, len(X["train"]), (4096,))
    opt.zero_grad()
    F.binary_cross_entropy_with_logits(m(X["train"][j]).squeeze(-1), Y["train"][j], pos_weight=pw).backward(); opt.step()
m.eval()

with torch.no_grad():
    lo = {s: torch.cat([m(X[s][i:i + 65536]).squeeze(-1) for i in range(0, len(X[s]), 65536)]) for s in ("val", "test")}
tau = pick_tau(lo["val"], Y["val"] > 0)                    # threshold tuned on VAL ...
p = (lo["test"] > tau).reshape(-1, N).numpy(); t = (Y["test"] > 0).reshape(-1, N).numpy()
print(f"localization macro-F1: {macro_f1(p, t):.3f}")      # ... reported on TEST
report(torch.tensor(p.ravel()), torch.tensor(t.ravel()))
# localization macro-F1: 0.915
# DR 0.859  FA 0.0002  F1 0.916          (~5 min CPU)
Per-family test DR at that operating point (benign-bus FA 0.01%): Ad 0.94, Aq 0.90, As 0.87 zero-shot, Ar 0.73 zero-shot. Adding the excluded families back drops the pooled all-family F1 to ~0.83, almost entirely because the slow ramp At (DR ~0.10) evades the temporal feature by construction — that gap is the open problem this dataset poses, and the examples below keep it visible by training on every family.
2. Graph model — ARMAConv (PyTorch-Geometric), all families. format="pyg" yields ready Data objects (swing rides along as a node attribute) and a graph-batching loader; preload=True caches the split in RAM so epochs take seconds instead of minutes. Needs pip install "fdia-graph[pyg]".
import torch, torch.nn.functional as F
from torch_geometric.nn import ARMAConv
import fdia_graph as fg

ds = {s: fg.load("ieee118", split=s, format="pyg", preload=True) for s in ("train", "val", "test")}
stats = fg.load("ieee118", split="train").to_numpy(["node_x"])["node_x"]
MU = torch.tensor(stats.mean((0, 1))); SD = torch.tensor(stats.std((0, 1)) + 1e-9)

class GNN(torch.nn.Module):
    def __init__(self, c=6, h=32):
        super().__init__(); self.a = ARMAConv(c, h); self.b = ARMAConv(h, 1)
    def forward(self, g):
        x = torch.cat([(g.x - MU) / SD, g.swing], -1)      # measurements + the swing feature
        return self.b(F.relu(self.a(x, g.edge_index)), g.edge_index).squeeze(-1)

net = GNN(); opt = torch.optim.Adam(net.parameters(), 1e-3); pw = torch.tensor(43.0)
for epoch in range(8):
    for batch in ds["train"].loader(batch_size=64):
        opt.zero_grad()
        F.binary_cross_entropy_with_logits(net(batch), batch.y, pos_weight=pw).backward(); opt.step()

with torch.no_grad():
    ev = {s: [(net(b), b.y > 0) for b in ds[s].loader(batch_size=256, shuffle=False)] for s in ("val", "test")}
lo = {s: torch.cat([x for x, _ in ev[s]]) for s in ev}; yy = {s: torch.cat([y for _, y in ev[s]]) for s in ev}
tau = pick_tau(lo["val"], yy["val"])
report(lo["test"] > tau, yy["test"])
# DR 0.455  FA 0.0009  F1 0.609          (~2.5 min CPU; val F1 is flat from epoch 1 — saturated)
The honest reading: the graph model saturates below the per-bus MLP, and in our papers the same holds with both reading the identical 14-dim input. Spatial message passing smooths exactly the localized per-bus signal swing carries, so graph structure alone does not add localization power here — beating the lightweight baseline with graph or physics information is a research target, not a given.
3. Temporal model — a plain LSTM on the continuous stream. The stream ships raw measurements only, so the example builds its features in place: train-normalized raw channels plus a per-window z-score. Numbers are lower than on the shard for a structural reason: inside a sustained attack episode the rolling window is already contaminated by the attack, so the anomaly fades after onset (temporal-baseline poisoning). The shard's swing avoids this because it was computed against clean history at generation time. Needs pip install "fdia-graph[torch]".
import torch, torch.nn as nn, torch.nn.functional as F
import fdia_graph as fg

(Xtr, ytr), (Xva, yva), (Xte, yte) = fg.torch_windows("ieee118", W=16, stride=8, val_frac=0.1)
mu = Xtr.mean((0, 1)); sd = Xtr.std((0, 1)) + 1e-9
def feats(X):     # measurements (train-normalized) + per-window z-score (the temporal spike feature)
    return torch.cat([(X - mu) / sd, (X - X.mean(1, keepdim=True)) / (X.std(1, keepdim=True) + 1e-6)], -1)
Xtr, Xva, Xte = feats(Xtr), feats(Xva), feats(Xte)

class LSTMDet(nn.Module):
    def __init__(self, c=8, h=32):
        super().__init__(); self.lstm = nn.LSTM(c, h, batch_first=True); self.fc = nn.Linear(h, 1)
    def forward(self, x): return self.fc(self.lstm(x)[0][:, -1]).squeeze(-1)

m = LSTMDet(); opt = torch.optim.Adam(m.parameters(), 1e-3)
pw = (1 - ytr.mean()) / ytr.mean()
for epoch in range(10):
    for i in range(0, len(Xtr), 256):
        opt.zero_grad()
        F.binary_cross_entropy_with_logits(m(Xtr[i:i + 256]), ytr[i:i + 256], pos_weight=pw).backward(); opt.step()

with torch.no_grad():
    lova = torch.cat([m(Xva[i:i + 4096]) for i in range(0, len(Xva), 4096)])
    lote = torch.cat([m(Xte[i:i + 4096]) for i in range(0, len(Xte), 4096)])
tau = pick_tau(lova, yva > 0)
report(lote > tau, yte > 0)
# DR 0.372  FA 0.0055  F1 0.463          (~3.5 min CPU; val F1 0.39 -> 0.47 from 5 to 10 epochs — some headroom left)
These are minutes-of-CPU baselines with deliberate headroom, not the dataset's ceiling. layer="benign"/"clean" on the stream helpers swaps the model input layer (the label stays the attack target); for a state estimator, window the clean layer as the target per the recipe above.
Dataset statistics
Per-system size — the classification shard (fg.load) is 72,000 records per system (36k benign + 6k × 6 attack families), split chronologically 60/20/20:
| system | N buses | E branches | records | train | val | test |
|---|---|---|---|---|---|---|
| ieee14 | 14 | 20 | 72,000 | 43,200 | 14,400 | 14,400 |
| ieee30 | 30 | 41 | 72,000 | 43,200 | 14,400 | 14,400 |
| ieee57 | 57 | 80 | 72,000 | 43,200 | 14,400 | 14,400 |
| ieee89 | 89 | 210 | 72,000 | 43,200 | 14,400 | 14,400 |
| ieee118 | 118 | 186 | 72,000 | 43,200 | 14,400 | 14,400 |
| ieee145 | 145 | 453 | 70,039 | 42,030 | 14,002 | 14,007 |
| ieee200 | 200 | 245 | 72,000 | 43,200 | 14,400 | 14,400 |
| ieee300 | 300 | 411 | 72,000 | 43,200 | 14,400 | 14,400 |
(ieee145 is slightly short because ~2.7% of its operating points don't converge.)
Attacks per split — every system uses the same recipe, and families are drawn from random timesteps, so each family is split ~60/20/20 with none concentrated in a partition (shown for ieee118):
| family | train | val | test | total |
|---|---|---|---|---|
| benign (0) | 21,646 | 7,239 | 7,115 | 36,000 |
Aq stealthy load-scale |
3,616 | 1,228 | 1,156 | 6,000 |
Ad meter corruption |
3,620 | 1,178 | 1,202 | 6,000 |
As meter scaling |
3,587 | 1,233 | 1,180 | 6,000 |
Ar replay |
3,666 | 1,121 | 1,213 | 6,000 |
At temporal ramp |
3,480 | 1,200 | 1,320 | 6,000 |
Al load redistribution |
3,585 | 1,201 | 1,214 | 6,000 |
The continuous stream (fg.load_stream, v0.7.1) is a separate 72,000-timestep timeline per system, ~50% attacked as timed episodes (At/ramp episodes are longest, so they carry the most attacked frames).
Operating-state distributions (from the 72k pool per system):
| system | |V| p1 / med / p99 (pu) | θ min / med / max (deg) |
|---|---|---|
| ieee14 | 1.010 / 1.052 / 1.090 | −21 / −14 / 0 |
| ieee30 | 0.956 / 0.980 / 1.000 | −6 / −2 / 3 |
| ieee57 | 0.689 / 0.880 / 1.040 | −34 / −13 / 0 |
| ieee89 | 0.961 / 1.034 / 1.084 | −17 / −3 / 33 |
| ieee118 | 0.943 / 0.984 / 1.050 | −1 / 20 / 46 |
| ieee145 | 0.920 / 1.064 / 1.155 | −180 / 2 / 180 |
| ieee200 | 0.980 / 1.018 / 1.040 | −46 / −37 / −22 |
| ieee300 | 0.869 / 0.992 / 1.065 | −91 / −15 / 64 |
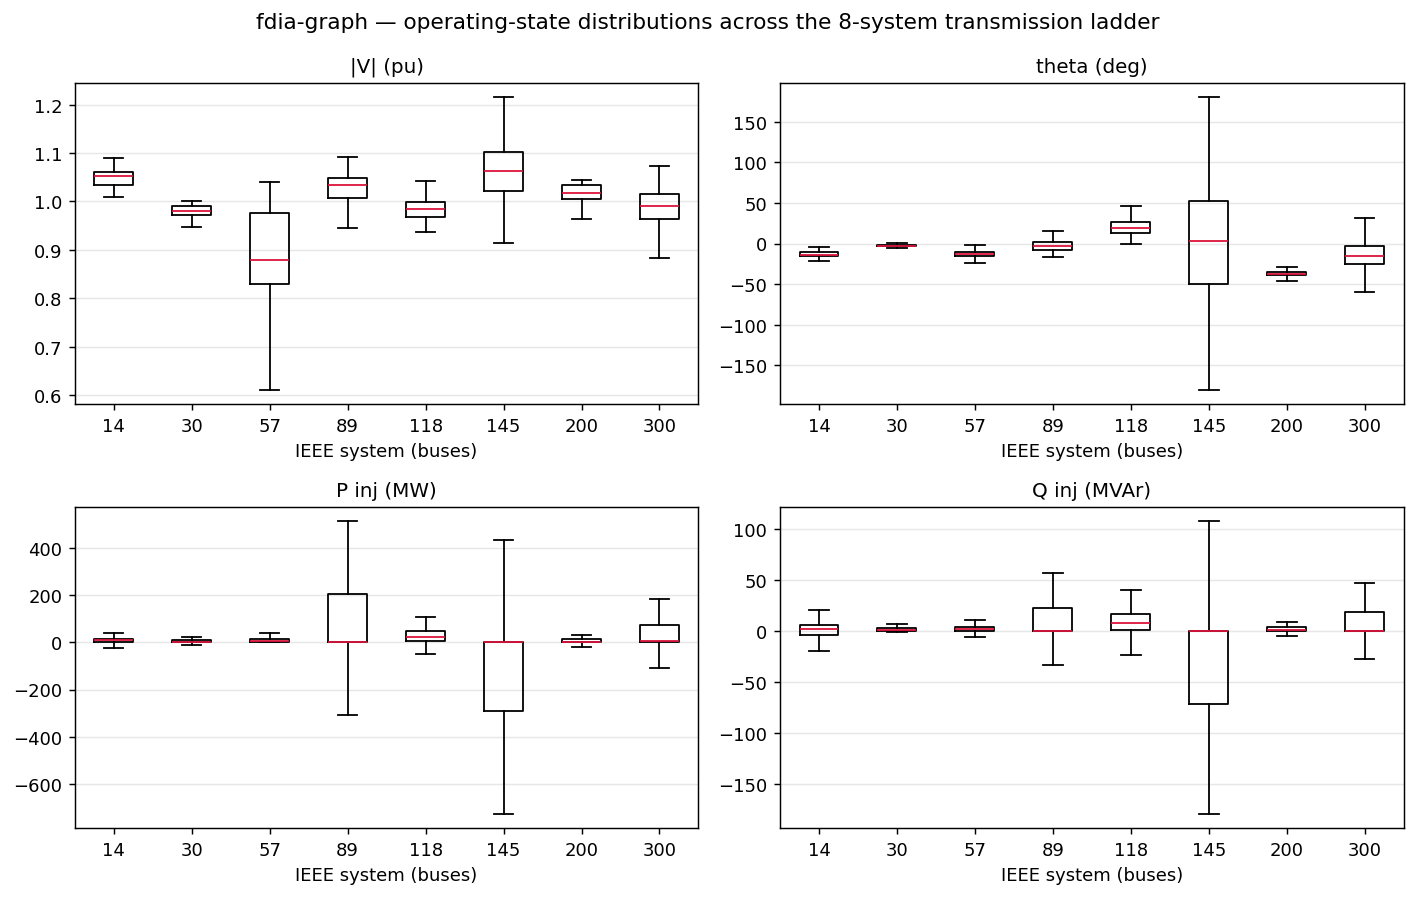
Per-bus |V|, θ, and P/Q injection distributions across the ladder (box = IQR, red = median; data in ../figures/fig_dataset_stats.csv). Two systems are outliers by construction of the MATPOWER base case, not our generation: case57 runs chronically low-voltage (33 of 57 buses below 0.9 pu even unscaled) and case145 has a very wide angle spread. Both are valid converged operating points; the states are still real, just atypical.